Model Audit
P
Machine Learning Performance
Train/validation behavior and test-set performance, aligned with the original Streamlit analysis.
Accuracy and LossConfusion MatrixMetrics Table
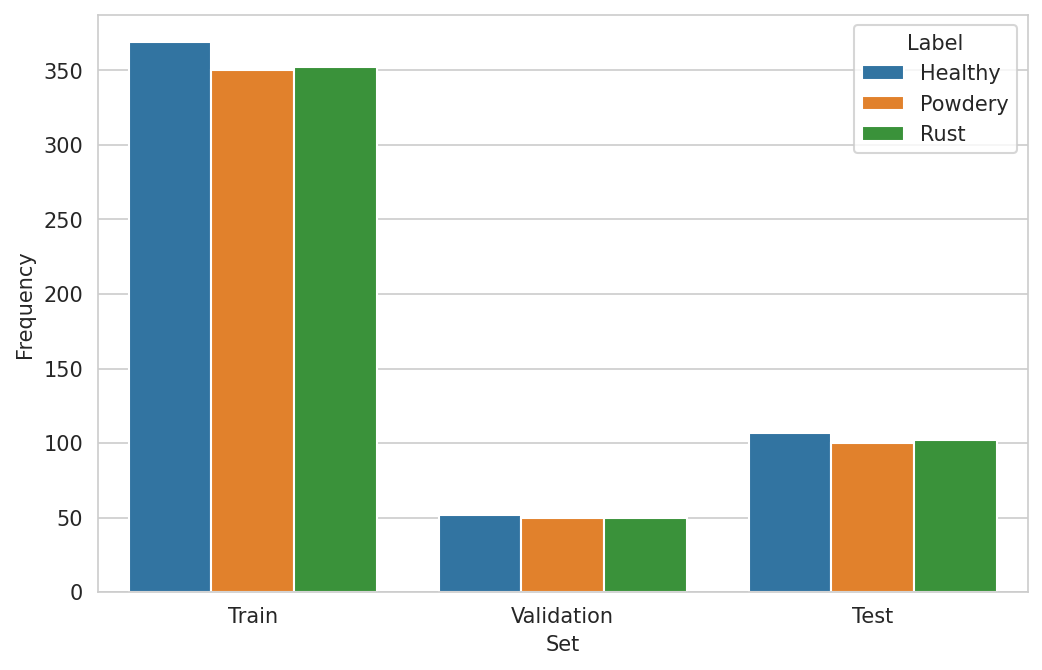
Train, Validation and Test Set: Labels Frequencies
Dataset has Healthy, Powdery, and Rust leaves split into Train (70%), Validation (10%), and Test (20%).
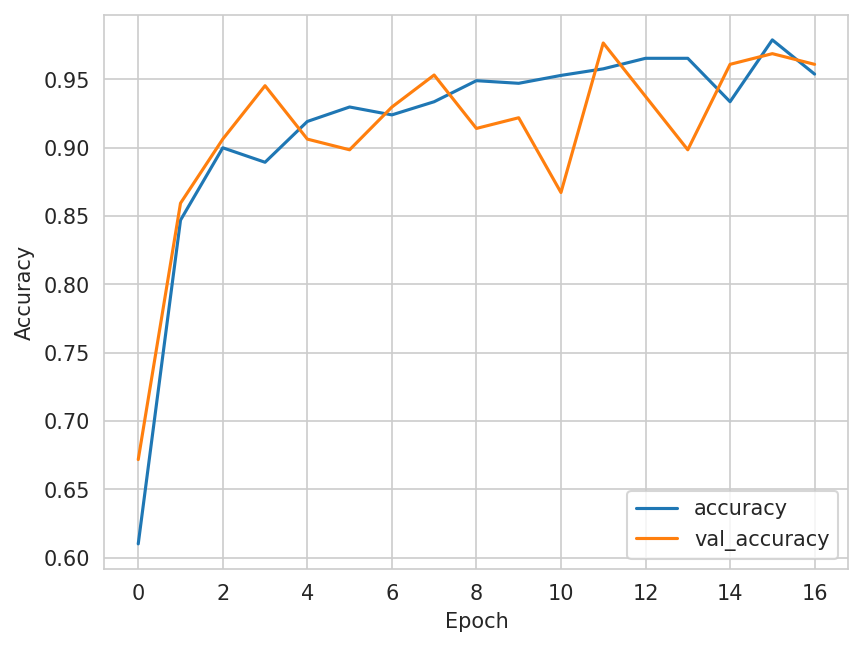
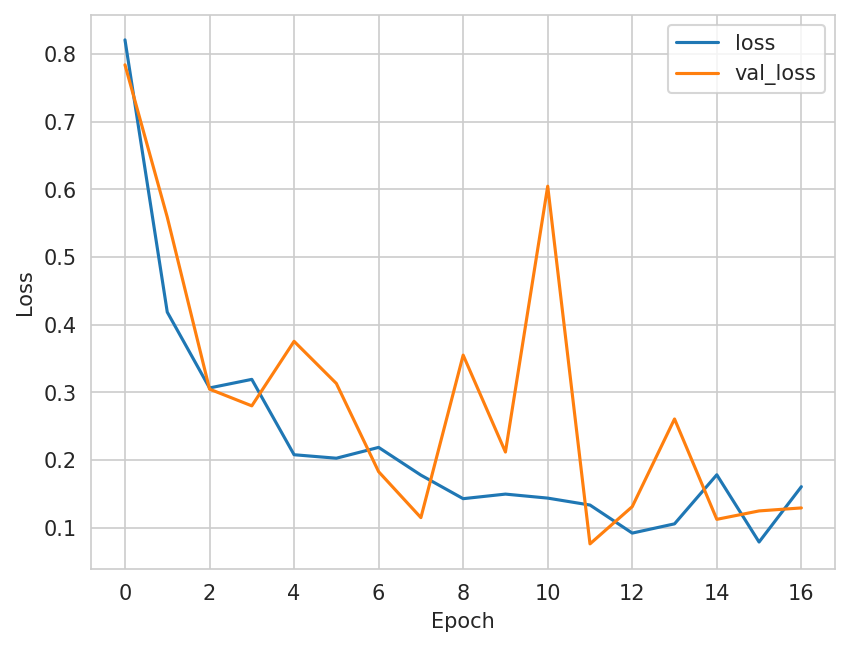
Model History
Accuracy and loss trends suggest a stable fit, with train and validation curves following similar patterns.
Generalised Performance on Test Set
| Metric | Value |
|---|---|
| Loss | 0.1447 |
| Accuracy | 95.14% |
Confusion Matrix
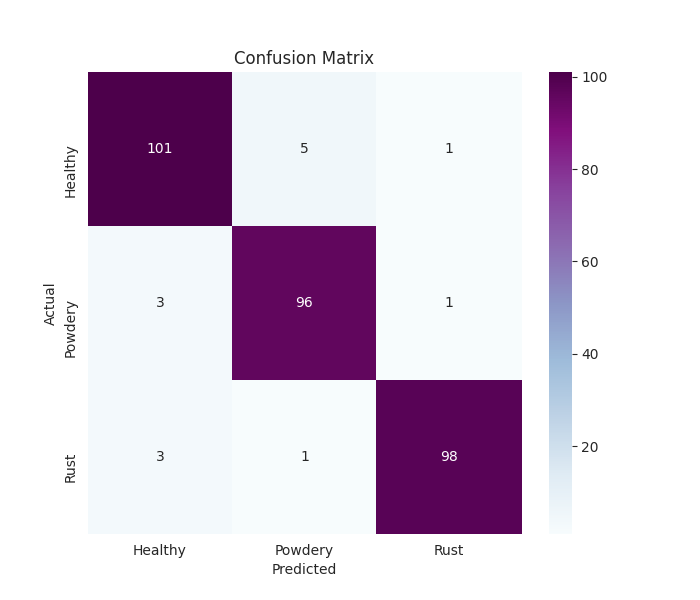
| Actual \ Predicted | Healthy | Powdery | Rust |
|---|---|---|---|
| Healthy | 101 | 5 | 1 |
| Powdery | 3 | 96 | 1 |
| Rust | 3 | 1 | 98 |
Model Evaluation Metrics
| Metric | Value |
|---|---|
| accuracy | 0.9547 |
| precision | 0.9549 |
| recall | 0.9547 |
| f1_score | 0.9548 |
| specificity | 0.9439 |
Conclusion: the model maintains strong test performance around the 95% target while preserving disease treatment recommendations in the detector flow.